
Talk to Triumph:
From Data to District-Wide Action
How an investigation of student participation and achievement became a district-wide initiative and a longitudinal analysis of academic growth.
Snapshot Overview
👨💻My Role: Project originator, data analyst & co-presenter
🔨Tools: R (tidyverse, ggplot2), Excel, Canva
🔢 Data: Virtual classroom participation logs, course grades, Georgia Milestones, and Student Growth Percentiles (participation measured Nov–Apr SY26)
📊Records: ~10,000 students (Phase 1) | 2,783 matched Math students (Phase 2)
👥Stakeholders: School leadership, instructional leaders, 600+ teachers
🎯Outcome: Findings launched a district-wide instructional initiative. Follow-up analysis found the highest-participating students averaged 10 SGP points more growth than the lowest, a gap that held after controls (p < .001).
The Problem
Problem summary: Increasing student talk time was a coaching priority at Georgia Cyber Academy, but no one had tested whether verbal participation in virtual classrooms related to academic outcomes.
Research on virtual classrooms finds teachers do 70–80% of the talking (Gutentag et al., 2022). In a 60-minute class of 20 students, that leaves each student less than a minute to speak.
The platform logged microphone activations for every student, but that data had never been connected to academic records. Two questions went unanswered:
Do students who participate verbally more often perform better academically?
If so, is that participation, or do higher-achieving students simply participate more?
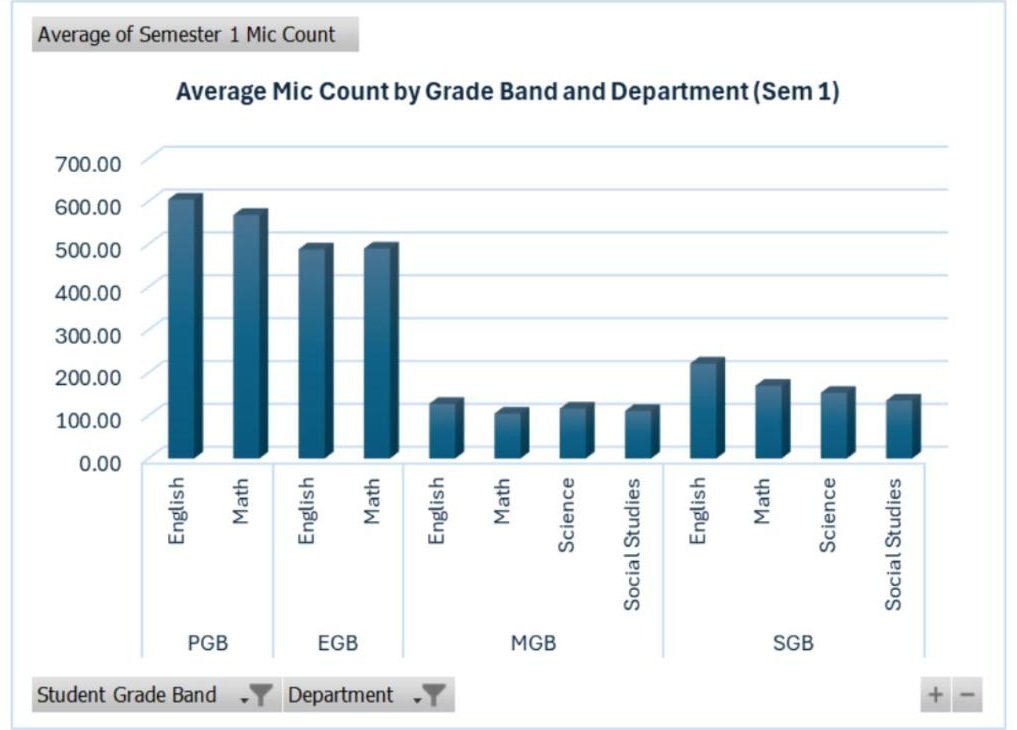
Semester 1 microphone activity varied widely by grade band and department.
The Objective
The objective was to turn existing engagement data into evidence that could guide instruction:
Measure the relationship between microphone participation and achievement
Test whether that relationship extended to academic growth
Account for prior achievement, attendance, and teacher effects before drawing conclusions
The Approach
Approach summary: Two phases: a large-scale achievement analysis that informed district policy, followed by a growth analysis built in response to teacher questions.
Phase 1: Participation & Achievement (2025)
Partnered with GCA's Accountability Team to obtain engagement and outcome data for ~10,000 students across all grades and subjects
Compared course grades, pass rates, and Georgia Milestones achievement across participation levels
Phase 2: Participation & Growth (2026)
Combined monthly participation datasets in R and matched them to longitudinal assessment records
Standardized activations per 60 minutes of instructional attendance
Compared average Student Growth Percentiles (SGP) across participation quintiles
Fit regression models controlling for prior achievement, attendance, assessment pathway, and teacher
The final Math analysis included 2,783 students. All student data was handled under FERPA and reported only in aggregate.
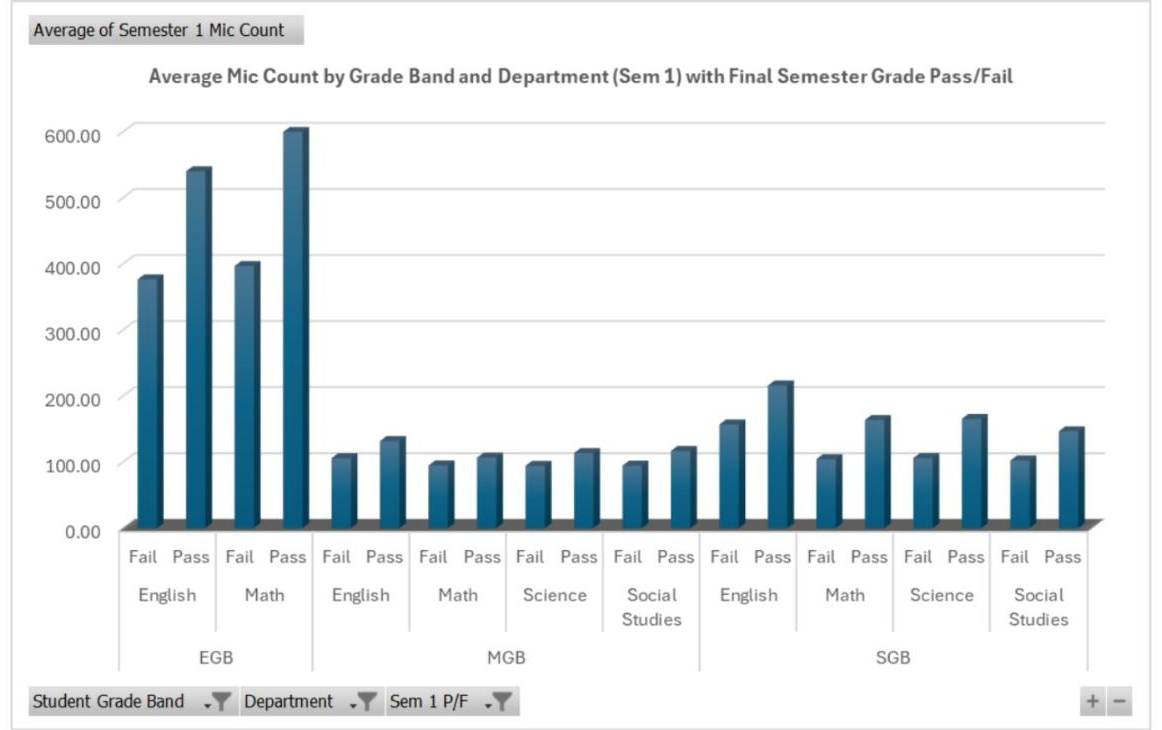
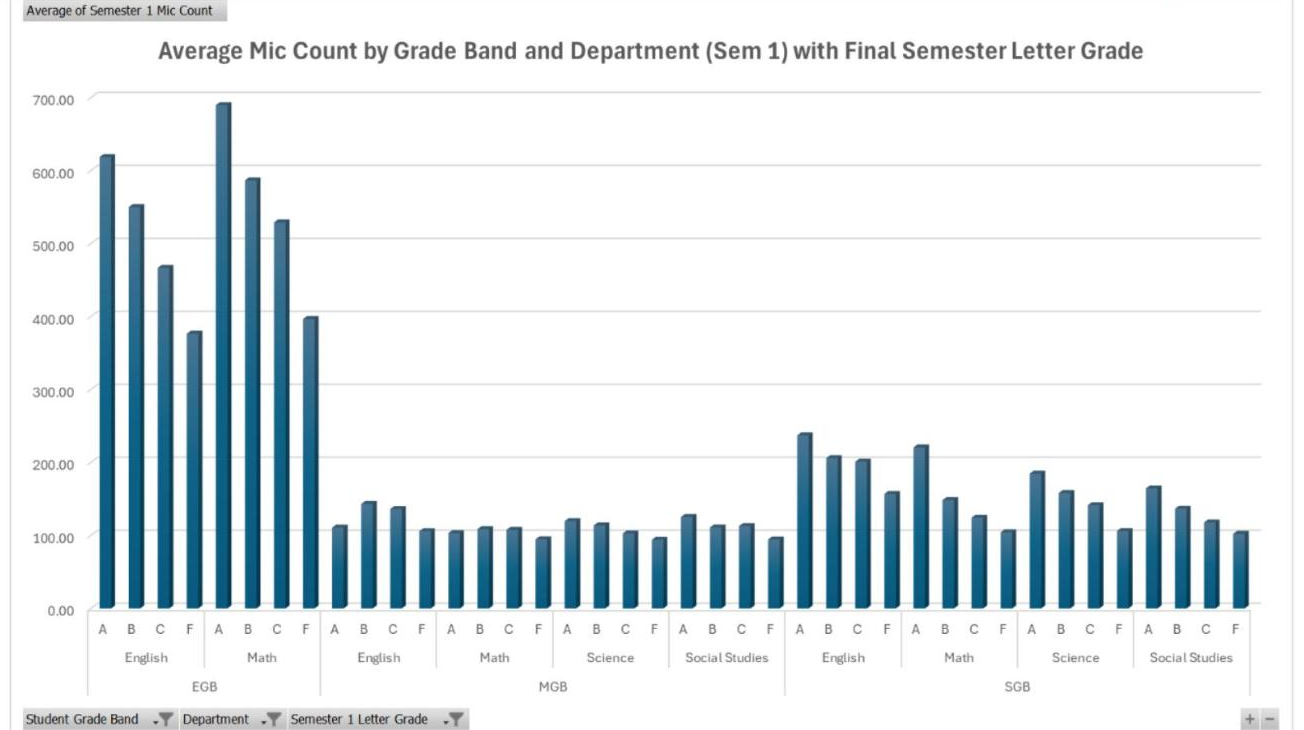
Phase 1: average Semester 1 mic count by pass/fail outcome (left) and final letter grade (right).
Skills Applied
Data Integration
Built crosswalk tables to match records across systems with different student identifiers.Feature Engineering
Standardized participation by instructional time for fair comparisons.Statistical Modeling (R)
Regression with controls for prior achievement, attendance, pathway, and teacher.Communicating Limitations
Presented effect size, explained variance, and causal limits clearly.Stakeholder Communication
Translated findings for leadership and 600+ teachers using ggplot2 and Canva.
The Solution
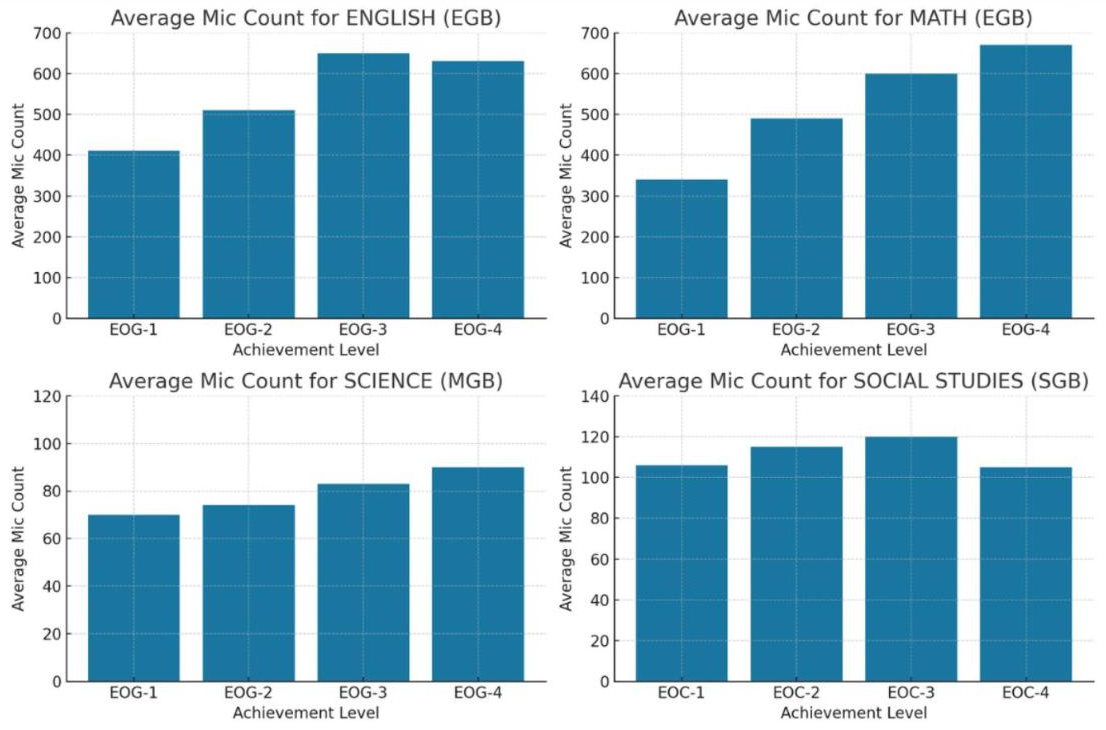
Phase 1: Students who passed their courses averaged more microphone activations than students who failed, in every grade band and subject. The link to letter grades and Georgia Milestones levels was strongest in elementary grades and less consistent in middle and high school. In elementary (EGB) Math, students scoring at Milestones Level 4 averaged roughly twice as many Semester 1 microphone activations as students at Level 1 (about 670 vs. 340). After I presented these results to leadership, Talk to Triumph was adopted district-wide. In November 2025, I co-presented the findings to more than 600 teachers with Martell Shavers, Assistant Director of Special Education Instruction.
Phase 2: Participation vs. Academic Growth
Participation quintile: median mic events per hour → average SGP
Lowest: 0.99 → 40.9
Low: 1.57 → 43.3
Middle: 2.23 → 45.1
High: 3.83 → 48.4
Highest: 12.3 → 50.9
Growth rose at every participation level. An SGP of 50 is typical growth relative to academic peers, so the highest group grew at the median while the lowest grew well below it. After adjusting for prior achievement, Math attendance, and grade level, predicted SGP still rose from about 41 to about 51 across the range of participation (p < .001). Most of that gain came between 0 and 4 events per hour, after which gains slowed.
Key Challenges
Mismatched identifiers
Participation and assessment systems used different student IDs, requiring crosswalk tables and match validation.Unequal attendance
Raw activation counts favored students who simply attended more. Standardizing by time put every student on the same scale."High achievers just talk more"
Teachers questioned the Phase 1 results. Shifting the outcome to growth and controlling for prior achievement addressed that directly.Modest explained variance
The adjusted model explained about 4% of variation in growth, so I presented participation as one meaningful factor, not a primary driver.
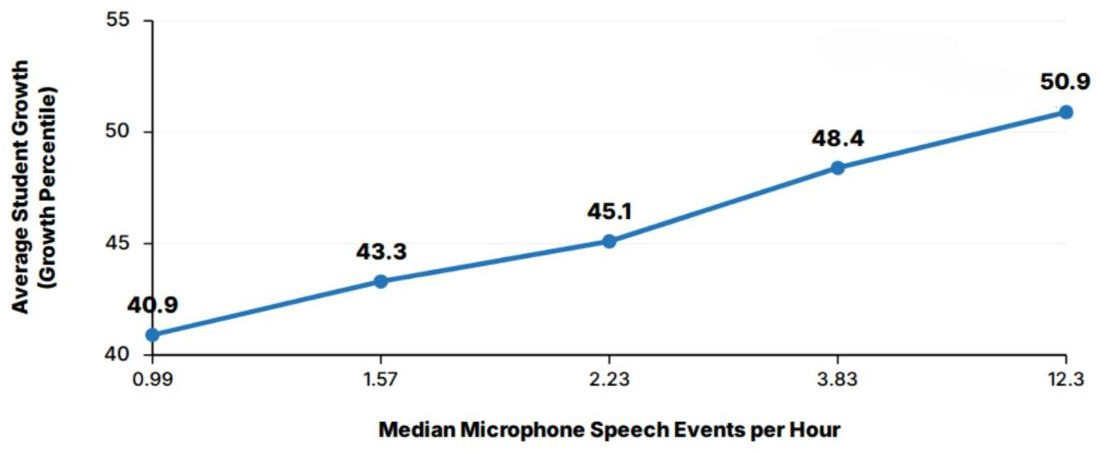
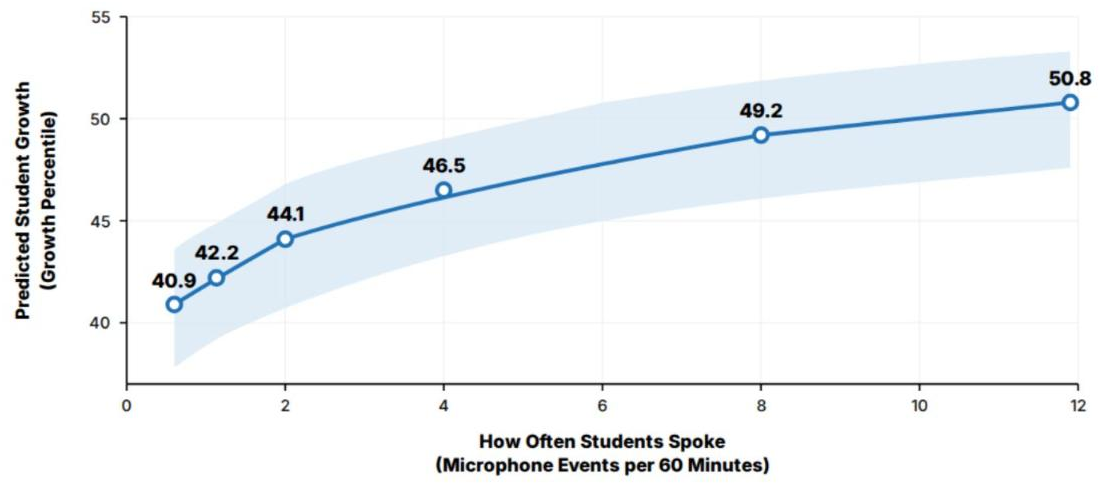
Phase 2 (n = 2,783). Top: raw average SGP by participation quintile. Bottom: predicted growth after controls; the shaded band shows the range of uncertainty.
Key Insights & Impact
Key Insights
Participation was associated with growth, not just achievement. This weakened the explanation that high achievers simply participate more.
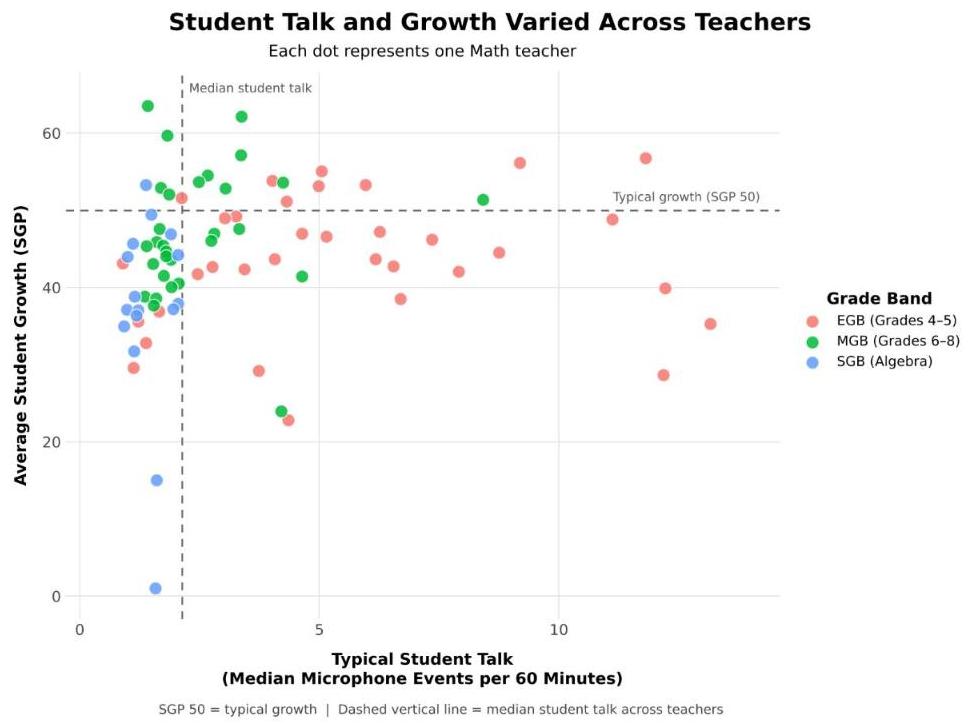
Talk alone did not guarantee growth. At the teacher level, several classrooms with high student talk still averaged below-typical growth, so participation works alongside instructional quality rather than replacing it.
Stakeholder skepticism improved the analysis. The central design decision in Phase 2 came directly from teacher feedback.
Impact
Talk to Triumph adopted as a district-wide instructional initiative
Findings presented to 600+ teachers
Verbal participation repositioned as an intentional instructional priority
Reflection & What's Next
My biggest takeaway was the value of letting stakeholder questions shape the next analysis. Teachers' skepticism made this work stronger.
Middle and high school teachers also pointed out that many students participate through chat rather than microphones. The next phase will:
Measure how chat participation relates to achievement and growth
Test whether a combined engagement measure explains more than either one alone